Data wrangling for everyone.
GitData is an easy to use, fast, scalable, distributed data extraction system that allows you to view & share data in an unusually rich variety of ways.
Explore data by dragging & dropping a URL into the Fetch box below!

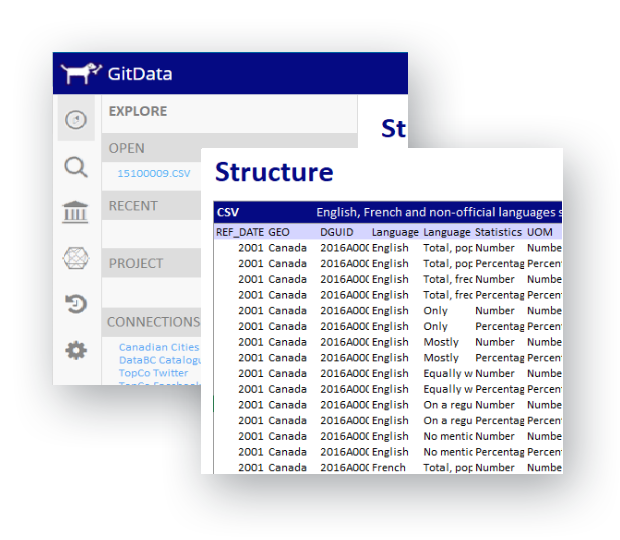
Waste no time downloading files and coding just to see if a dataset is worth your while. Simply drag or paste the file's URL and GitData will show you the what the data file's structure looks like.
Sign UpIn the structure module, you have the ability to explore the data's contents, including the each variable's name, values, and relationships (if applicable).

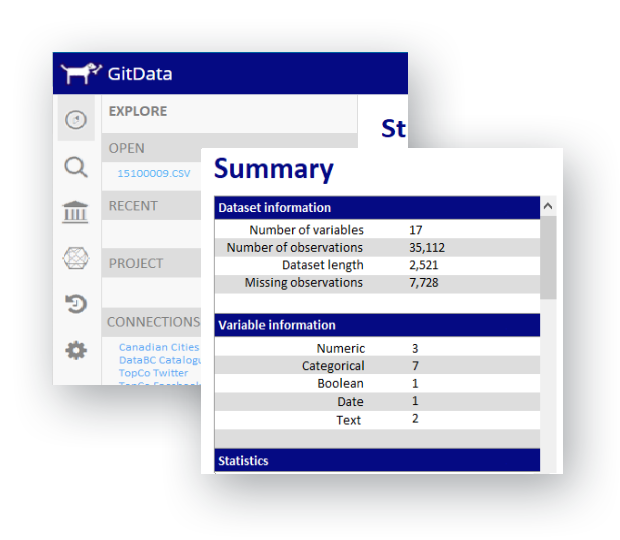
Find out more about the dataset in the Statistics module. GitData will give you important information such as the number of variables, number of observations, completeness of data, and storage size.
Sign UpSummary statistics, including each numeric variable's distribution, frequency, sum, mean, median, minimum, and maximum, and the number of categorical variables, enable you to uncover facts.

Visualizations help you draw insights that can otherwise be difficult to detect. GitData creates many types of visuals for the variables in your dataset, so you can begin to interpret how different variables interact with each other.
Sign UpNumeric values will be represented with bar charts, scatterplots, and line charts. Categorical values are inserted into pie and bar charts. Observing data visualizations allows you to make assumptions about the dataset.
